
Inside the Rates Modelling box with Infor EPM
For rates officers and finance system administrators responsible for Australian and New Zealand Council rates modelling

Built for the Problem, Not Repurposed for It
There is no shortage of financial planning and modelling software on the market. What has been missing, until now, has been a solution that addresses the key challenges of the complex and high-stakes process of modelling local government rates.
The AcQuum Rates Modelling Application is not a general-purpose budgeting tool adapted for councils. It is an application built from the ground up for rates modelling, using the Infor EPM platform, a proven cloud-based enterprise performance management platform, and designed to work in lockstep with Infor Pathway.
Here’s what that looks like in practice.
The Infor EPM Platform
The Rates Modelling Application is built on Infor EPM, a cloud-based platform designed for reporting, modelling, budgeting, and planning. With a global reputation, Infor EPM is hosted on modern AWS cloud architecture, with ISO 27001 for information security.
Infor EPM is included in the Infor Pathway SaaS licence, so there is no additional platform cost to access the environment where the Rates Modelling Application runs. It integrates natively with Pathway and other data sources via Infor Data Fabric, also included in the licence, which serves as Infor's data lake, consolidating data from multiple sources via APIs and making it available for reporting and analysis in one place. Infor EPM is already in use by organisations across local government, financial services, education, and the not-for-profit sector in Australia and New Zealand.
Beyond rates modelling, Infor EPM can also be used for annual and monthly financial reporting and dashboarding for Councillors and other Executive team members, long-term financial planning, asset and infrastructure modelling, and workforce and salary planning. The Rates Modelling Application is one purpose-built application within that broader capability set.
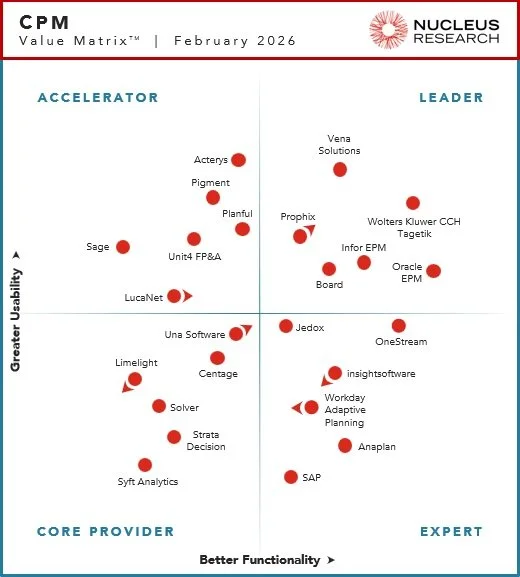
Infor EPM is independently recognised as a Leader in the Nucleus Research CPM Technology Value Matrix 2026, placing it among a select group of platforms that deliver the highest combination of usability and functionality in corporate performance management. For councils, that means confidence in the platform underpinning the Rates Modelling Application: proven, enterprise-grade, and built for the complexity of modern finance.
Integrating with Pathway Data
The starting point for every modelling period is accurate base data. The application is designed to make this as reliable and efficient as possible through a direct integration with Infor Pathway.
Pathway’s latest release introduced dedicated export functionality that generates three structured data files, covering rate types, assessment data, and assessment rate type data, ready to import into Infor EPM. This export can be filtered by assessment range, rating period, valuation year, and previous levy period. This export process makes the solution suitable for both on premise and SaaS based councils.
Once exported, those files are imported into the Rates Modelling Application through a guided workflow. The import process can be completed manually, or configured to run automatically on a schedule, with the option to trigger a manual refresh when you’re ready to begin modelling.
This integration replaces the error-prone, time-consuming process of manually extracting, formatting, and loading data from Pathway into a spreadsheet model, one of the most consistently cited pain points among rates teams. To close the loop, the adopted models parameters can be imported back into a test set in Pathway, again removing any need for re-keying.
Predictability with Modelling Workflow
The application is structured around a clear, logical workflow. Each step builds on the last, and the system tracks progress and status throughout, so anyone picking up the process mid-way has visibility of where things stand and what decisions have been made. The ability to add comments at each workflow stage also creates an in-system record of the decision-making behind each model, useful both for governance and for anyone revisiting the process in a future rating period.
Step 1: Import Rates Data from Pathway
The workflow begins by loading Pathway rates and valuation data directly into Infor EPM. This includes prior year charges, assessment details, and property data. The import can be completed via manual file transfer or, when Infor’s data fabric capability is available, configured to run automatically, eliminating the need for manual intervention. Both methods are supported. The result is a clean, structured dataset ready for modelling, without the manual extraction and reformatting that characterises spreadsheet-based processes.
Step 2: Review, Adjust and Lock Your Valuation Base
Before modelling begins, the valuation base needs to be accurate. The application provides both granular assessment-level views and high-level visualisations for reviewing and validating data imported from Pathway. At this stage, new rate types and rate bands can be added, supplementary assessments can be included, and adjustments can be made to individual properties where needed. Broader valuation base adjustments, such as a CPI uplift, a general growth bucket for anticipated supplementary assessments, or the selection of a valuation averaging method (one, two, or three years), are also configured here.
Once the valuation base has been reviewed and confirmed, it is locked. This defines the property data used to calculate total generated rates across all scenarios, providing the modelling process with a stable, auditable foundation.
Step 3: Adjust Your Drivers
With the valuation base set, scenario modelling begins. This step involves creating or adjusting the rate drivers that will generate projected revenue, including adding new charges, setting minimums and caps, and calculating or adjusting the rate in the dollar (RID). The application supports differential rating, banding, and weighted calculations, allowing, for example, commercial rate types to be configured to carry a larger distribution of rate revenue than residential rate types. Multiple scenarios can be built and held simultaneously, each with its own driver configuration.
Step 4: Set Your Revenue Target
Each scenario allows you to set a target revenue figure, either entered manually or calculated as an adjustment to the prior year’s revenue by a specified percentage. Both options offer flexibility to define the target as a global revenue goal across all rate types or broken down by individual rate type. Each option provides flexibility for a global revenue goal or for splitting it by rate type.
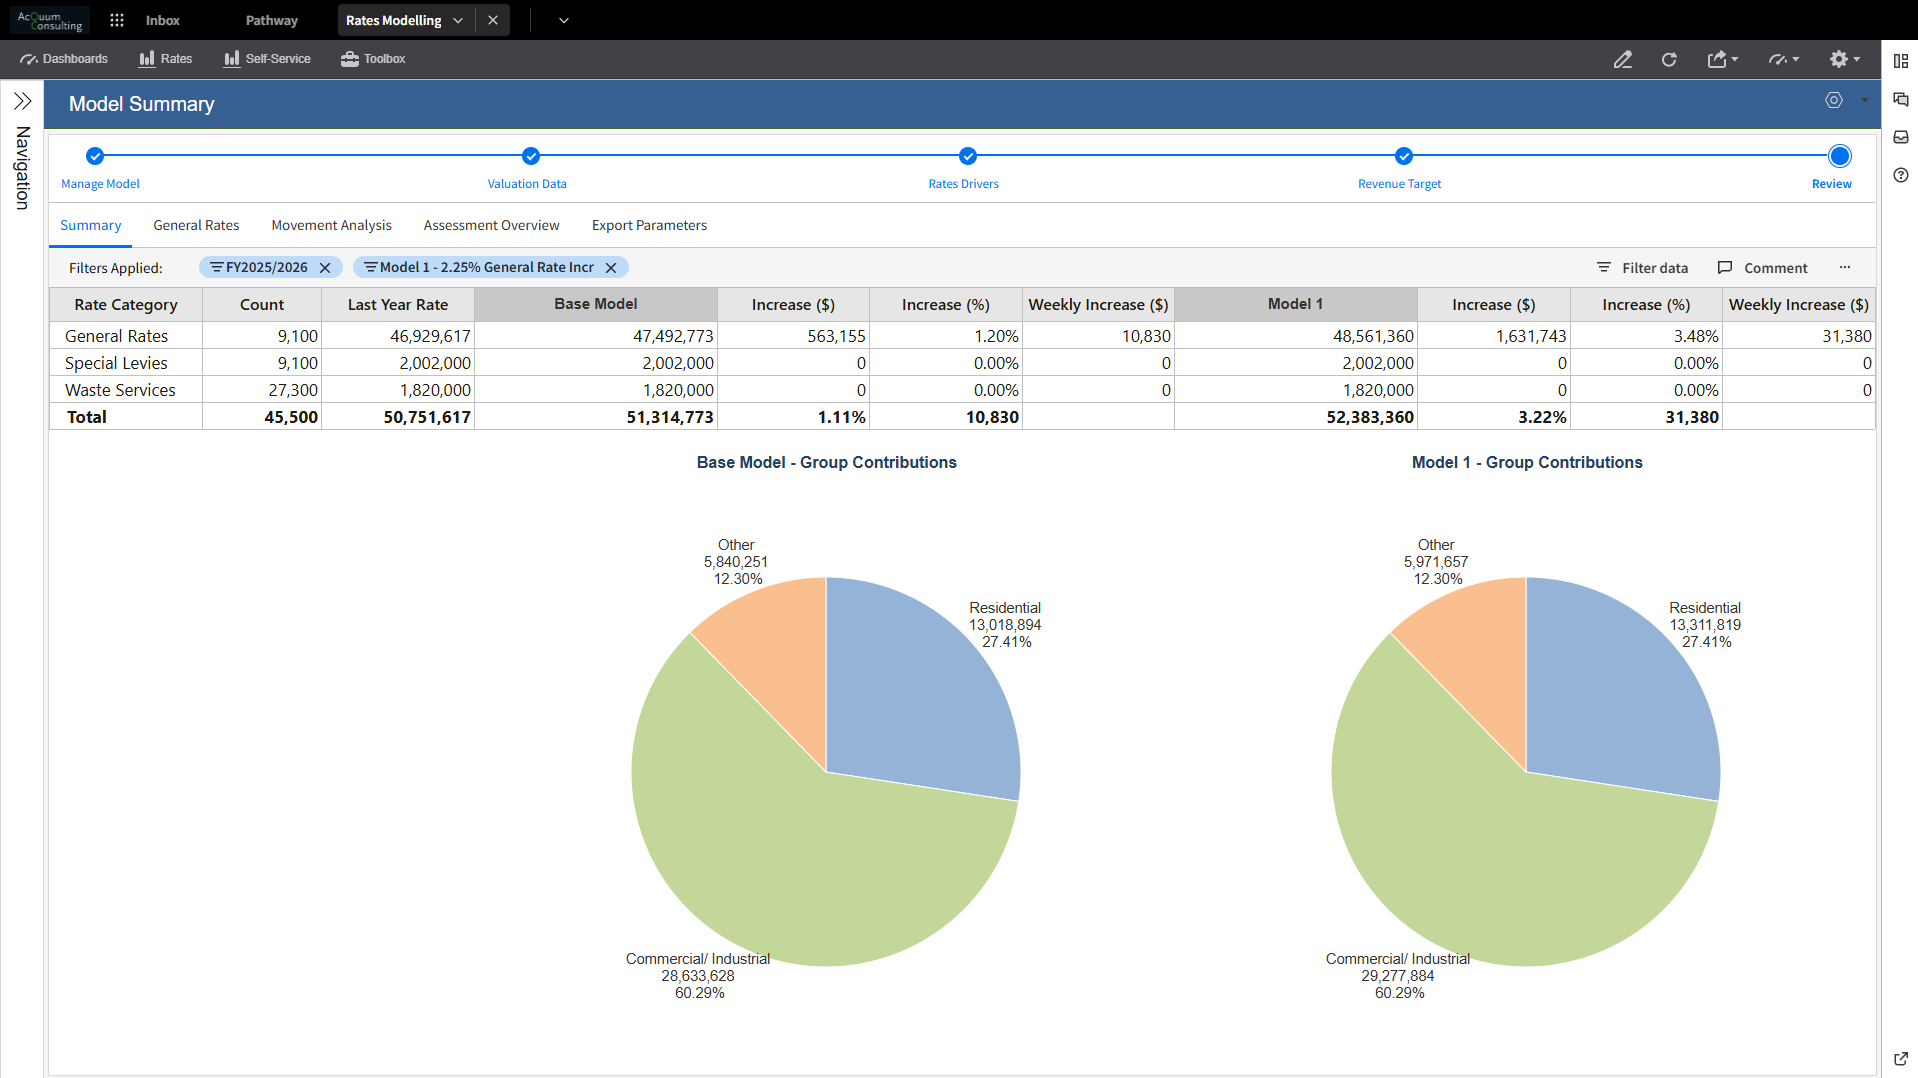
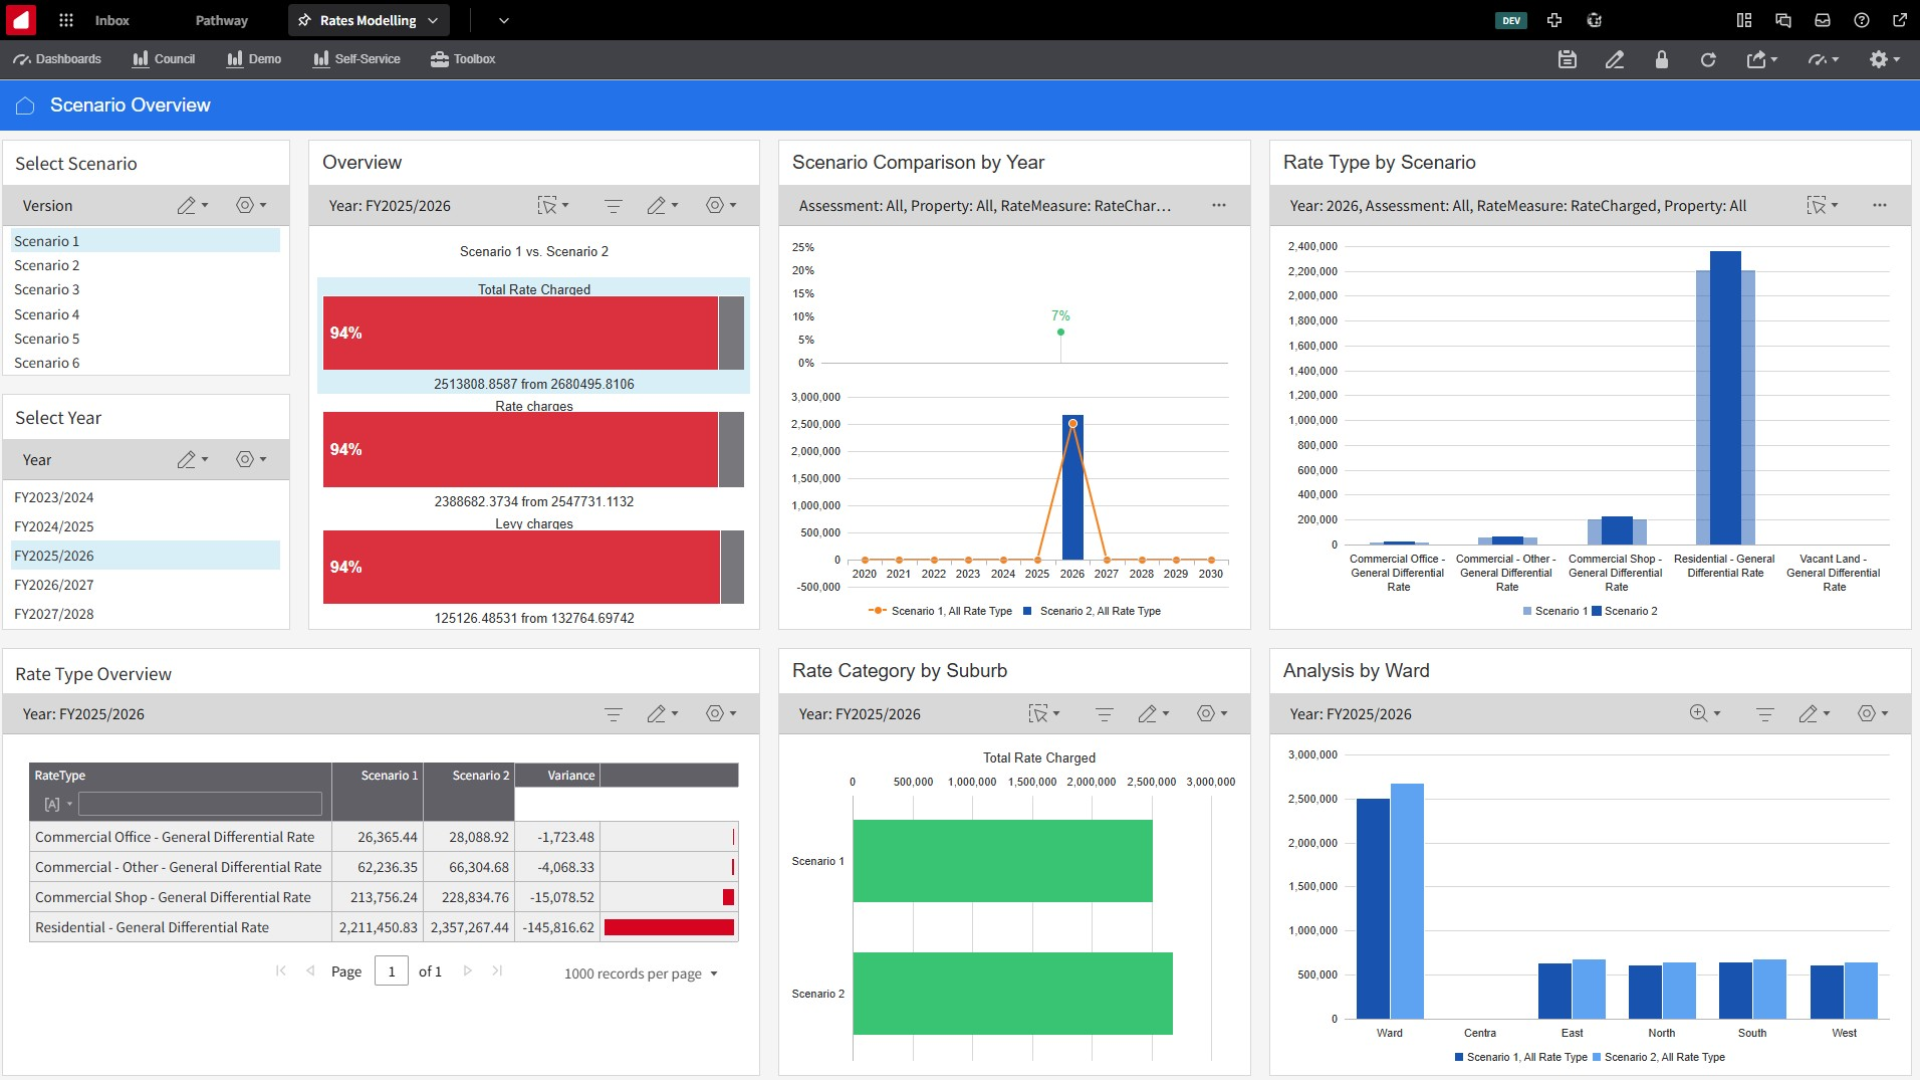
Step 5: Scenario Analysis
Once scenarios have been modelled, the application’s reporting and dashboard capabilities provide the tools to compare and interrogate the results. Pre-built reports and self-service dashboards support both visual and data-driven analysis, including side-by-side scenario comparisons and compliance checks of model output. Comparison reports can be generated directly from the system for use in budget meetings and councillor briefings, removing the need to manually compile summary tables from spreadsheet outputs.
Step 6: Model Adoption and Export to Pathway
When a preferred scenario has been identified, it is marked as adopted within the application. The modelled parameters are then exported and imported directly into Pathway as a test set, where a prediction report can be run to confirm the final dollar value of rates to be generated. This round-trip integration closes the loop between modelling and validation, giving rates teams confidence in their output before any parameters are finalised and committed.
Reporting, Analysis, and Governance
Beyond the core modelling workflow, prebuilt reports and dashboards, the application provides self-service reporting and analysis capability. Reports and charts can be created within the platform, including prior year comparisons at the rate type or assessment level, and saved as favourites to be returned to each rating period.
Where councils have suburbs and wards configured in Pathway, that property data is available within the application for geographic analysis and reporting. Custom groupings and hierarchies can also be built within Infor EPM to support any specific analysis needs, for example, isolating a subset of assessments to test the impact of a parameter change or analysing the average household impact of models.
The workflow status tracking, scenario commentary, and audit trail built into the application mean that the modelling process is documented as it happens, reducing key person risk and making it easier for multiple team members to be involved in or review the process.
Current Scope and What’s Coming
The initial release of the Rates Modelling Application covers the core rates modelling workflow, including fixed charges and rate-in-the-dollar charges.
The data fabric integration, which will automate the data transfer between Pathway and Infor EPM, removing the need for manual file import, is on the Infor Pathway development roadmap and will be supported as it becomes available. Manual file import will continue to be supported alongside it.
Jurisdiction-specific requirements beyond the Queensland baseline, such as rate capping in Victoria and NSW, or other state-specific legislative requirements, will be validated through early adopter engagements with councils in those regions.
Ready to See It in Action?
If you’d like to understand what the Rates Modelling Application would look like for your council, including what implementation involves, how it fits with your existing Pathway setup, and what pricing looks like based on your council’s size, we’d welcome the conversation.
Get in touch:
Get in touch to book a discovery session, to explore if this is a good fit for your council needs or visit our Rates Modelling solution page to learn more .
For councils outside Queensland, early adopter opportunities are available with preferential pricing for councils who participate in jurisdiction-specific validation testing.